Tag: Technical Analysis

  • XRP’s ‘Death Cross’ Signals Deeper Corrections as Analysts Eye $1.80-$2.10 Range

    XRP’s ‘Death Cross’ Signals Deeper Corrections as Analysts Eye $1.80-$2.10 Range

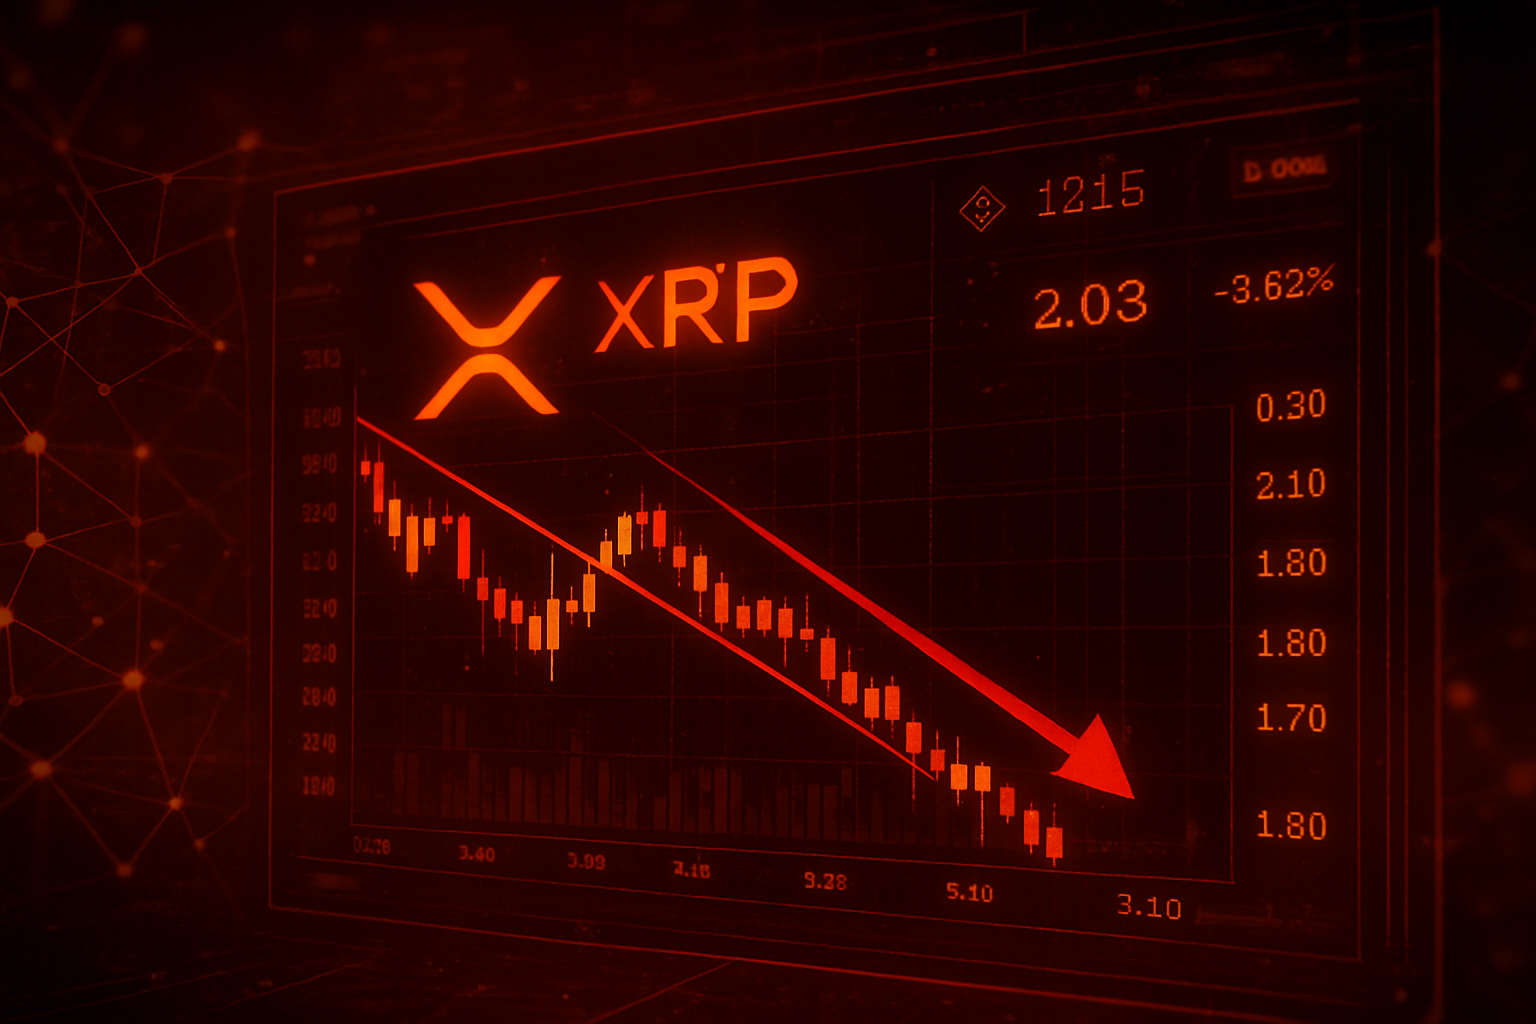
    New York, NY – December 1, 2025 – The cryptocurrency market is abuzz as XRP, the digital asset associated with Ripple (private), has confirmed a significant 'Death Cross' technical pattern on its daily chart in late November, extending into the first days of December 2025. This ominous signal, where XRP's short-term 50-day moving average (SMA) plunged below its long-term 200-day SMA, has sent ripples of concern through the investor community, prompting technical analysts to warn of potential price drops towards the $1.80-$2.10 range.

    The immediate market reaction has been predominantly bearish, with XRP experiencing a notable decline as the crossover materialized. On December 1, 2025, XRP's price fell approximately 7%, hitting session minimums around $2.01, further cementing the bearish sentiment that had been building throughout November. This technical event is significant because it is widely interpreted as a strong indicator of a potential shift towards a long-term bearish trend, suggesting that downward momentum is likely to continue or intensify, influencing both retail and algorithmic trading strategies across the crypto ecosystem.

    Market Impact and Price Action

    The formation of the 'Death Cross' for XRP has been a culmination of sustained selling pressure and a broader market downturn. Leading up to the confirmation, XRP had already seen considerable weakness, with reports in early November highlighting its vulnerability. The 50-day moving average, a key indicator of short-term momentum, had been steadily declining, setting the stage for its eventual cross below the more stable 200-day moving average.

    In the immediate aftermath, XRP's price movements have been characterized by a struggle to hold key support levels. The confirmed 'Death Cross' on December 1, 2025, saw XRP's price drop to around $2.05, establishing new session lows. This decline followed earlier warnings from late November that predicted a slide towards the $1.50 range, drawing parallels to historical instances where similar patterns preceded drops of up to 15% for XRP. Trading volume surged by 92% within 24 hours on December 1, accompanying the price drop, indicating aggressive repositioning and liquidation waves that erased recent gains. This high volume during a price decline further underscores the strong bearish sentiment dominating the market.

    Technical analysis points to critical support levels that XRP must defend to prevent steeper losses. Analysts have identified significant floors around $2.20, with stronger support at $2.15, $2.10, and $2.05 based on classical pivot points. The much-discussed $1.80 and $2.00 levels are also cited as important demand zones, with $1.80 historically acting as a robust area of buyer interest. Should these levels fail, a breach below $2.20 could open the door to the $1.80-$2.10 range, or even deeper corrections towards $1.50 or the psychological $1.00 mark. Conversely, resistance levels are noted at $2.26, $2.31, and a formidable barrier between $2.30-$2.40. A decisive break above $2.40 would be needed to signal any potential bullish reversal.

    Comparing this event to past 'Death Crosses' reveals a mixed bag of outcomes. A similar pattern for XRP in May 2025 preceded several weeks of sideways and negative price action. However, some analysts, like EGRAG, caution against drawing direct parallels to severe past crashes, such as the 2018 bear market. They argue that a "true" bearish 'Death Cross' leading to steep declines requires the token to be trading below both moving averages with significantly slowing momentum, which was not entirely the case for XRP as it held above the 200 MA with an upward trend in late November. This suggests that while a 'Death Cross' is a bearish indicator, its impact can vary based on the broader market context and other underlying factors.

    Community and Ecosystem Response

    The XRP 'Death Cross' has ignited a firestorm of discussion across social media platforms, with crypto Twitter (X) and Reddit serving as primary hubs for analysis, predictions, and emotional reactions. The sentiment has been largely bearish, reflecting the technical warnings from analysts.

    Crypto influencers and thought leaders have largely converged on a cautious to bearish outlook. Analysts like "Umair" on X highlighted the 'Death Cross' on XRP's daily chart, projecting a potential 15% crash that could push XRP into the $1.50 range, citing historical precedents. Others forecasted even more significant corrections, with some suggesting a 50% drop to $1.25 if key support levels fail to hold. This widespread bearish prognostication from prominent voices has undoubtedly amplified market anxiety. FXEmpire and Finance Magnates also confirmed the 'Death Cross', supporting a bearish narrative and price predictions of $1.82 and $1.61, respectively, despite some ongoing XRP ETF inflows.

    However, not all sentiment was uniformly negative. A contrarian view emerged from influencers such as "Steph Is Crypto" on X, who pointed out that a similar 'Death Cross' pattern in 2017 actually preceded a substantial 10x rally for XRP. This perspective offered a glimmer of hope for some, suggesting that the event could be a capitulation point before a significant rebound. Nonetheless, the immediate trading activity on December 1, characterized by a 92% surge in volume alongside a price drop, indicated aggressive profit-taking and liquidation waves, underscoring the prevailing fear in the market.

    The XRP 'Death Cross' coincided with a broader market downturn. On December 1, 2025, major cryptocurrencies, including Bitcoin and Ethereum, experienced losses ranging from 5% to 9%, with nearly $638 million in leveraged positions liquidated across exchanges, almost 90% of which were long positions. This market-wide correction, attributed to thin liquidity and macro uncertainty, exacerbated XRP's struggles. While direct, specific impacts on XRP-related DeFi protocols, NFT projects, or Web3 applications were not explicitly detailed in the immediate aftermath, the general market caution would undoubtedly lead to a more conservative approach within these sectors. Ripple (private) itself continued to advance its ecosystem, with its APAC entity receiving expanded payment licenses from the Monetary Authority of Singapore (MAS) and its stablecoin, RLUSD, gaining recognition. Several spot XRP ETFs, including those from Grayscale (private), Bitwise (private), Franklin Templeton (NYSE: BEN), and Canary Capital (private), also launched in mid-November, suggesting ongoing institutional infrastructure development despite token volatility.

    What's Next for Crypto

    The confirmed 'Death Cross' for XRP, occurring amidst a broader market 'risk-off' environment, paints a cautious short-term outlook for the digital asset and the wider cryptocurrency space. In the immediate weeks, sustained selling pressure is anticipated for XRP, potentially retesting lower support levels and solidifying the $1.80-$2.10 range as a critical battleground. Similarly, Bitcoin (BTC) is grappling with its own 'Death Cross' confirmation from mid-November, trading near $93,000 after falling from October highs of $126,000, signaling potential further downside towards $83,500 and a major support zone at $74,000-$76,000.

    However, the long-term implications for the crypto market remain nuanced. While technical indicators suggest immediate pain, many analysts view 'Death Crosses' as lagging indicators that often appear after significant price drops have already occurred, potentially marking local market bottoms rather than the start of prolonged bear markets. Therefore, a period of consolidation followed by a gradual recovery into early to mid-2026 remains a medium-high likelihood scenario, contingent on improving macroeconomic conditions and a slow but steady increase in institutional interest.

    Several potential catalysts could shift the market's trajectory. Anticipated Federal Reserve rate cuts in late 2025 or throughout 2026 could inject significant liquidity into risk assets. Continued demand and adoption of Spot Bitcoin ETFs, alongside the growth of XRP-spot ETFs, are expected to fuel institutional participation. Regulatory advancements, such as the potential passing of the CLARITY Act by 2026, could provide much-needed confidence and integration. For XRP specifically, the ongoing resolution of the SEC vs. Ripple lawsuit remains a pivotal event, with a favorable outcome potentially unleashing renewed confidence. Technological innovations within Ethereum (e.g., Pectra and Fusako upgrades), advancements in DeFi, and the expansion of real-world asset (RWA) tokenization on platforms like the XRPL will also drive fundamental value.

    Strategic considerations for investors during this volatile period include short-term caution, diversification of holdings, and disciplined risk management, such as using trailing stop-losses. However, significant dips, especially around key support levels, could also present accumulation opportunities for long-term investors who believe in the underlying fundamentals and future growth of the crypto market. For projects, the emphasis should be on developing real-world utility, particularly in areas like AI, DeFi, and core blockchain infrastructure, to attract serious investors and withstand market downturns.

    Bottom Line

    The XRP 'Death Cross' signal, confirmed in late November and early December 2025, serves as a stark reminder of the inherent volatility and technical sensitivities within the cryptocurrency market. For crypto investors and enthusiasts, the key takeaway is to approach the current market with heightened caution, recognizing the potential for further price declines in the short term, with analysts eyeing the $1.80-$2.10 range as a critical support zone. The immediate aftermath has seen significant selling pressure and liquidations, indicating a prevailing 'risk-off' sentiment exacerbated by broader market weakness and macroeconomic uncertainties.

    Despite the immediate bearish technical signals, the long-term significance for XRP and the wider crypto market appears more resilient. The 'Death Cross' is a lagging indicator, and historical precedents suggest it can sometimes mark temporary downturns before eventual rebounds. Crucially, underlying drivers such as increasing institutional adoption, particularly through spot ETFs from entities like Franklin Templeton (NYSE: BEN) and Grayscale (private), and the ongoing pursuit of regulatory clarity are bolstering the long-term outlook. Ripple's (private) advancements in real-world asset (RWA) tokenization and the expansion of its stablecoin, RLUSD, continue to enhance XRP's utility and institutional appeal.

    Ultimately, this period of technical weakness does not fundamentally derail the long-term trend of crypto adoption. Instead, it highlights the maturation of the market, its growing sensitivity to macroeconomic factors, and the ongoing shift towards a more regulated and utility-driven ecosystem. While retail investor sentiment may fluctuate, institutional players often view such corrections as strategic accumulation opportunities. The path to broader crypto adoption will likely involve navigating these cyclical downturns, emphasizing the importance of robust fundamental development and clear regulatory frameworks.

    Important Dates, Events, or Metrics to Monitor:

    • XRP Price Levels: Watch for XRP's ability to hold support at $2.00, $1.90, and $1.61, and attempts to reclaim resistance at $2.19-$2.29 and $2.45.
    • XRP ETF Inflows/Outflows: Monitor institutional capital flows into XRP ETFs for signs of renewed demand.
    • Federal Reserve Interest Rate Decisions: Upcoming Fed meetings and any indications of rate cuts will significantly influence market liquidity.
    • SEC vs. Ripple Lawsuit: Any definitive outcome or significant progress in the lawsuit remains a pivotal event for XRP.
    • Regulatory Developments: Keep an eye on U.S. legislative progress (e.g., CLARITY Act) and global regulatory frameworks.
    • Ripple Ecosystem: Track RWA tokenization initiatives (2025-2026) and RLUSD stablecoin expansion (Q1 2026).
    • Bitcoin Price Action: Bitcoin's ability to hold $80,000-$85,000 support and overall crypto market capitalization will provide critical context.

    This article is for informational purposes only and does not constitute financial or investment advice. Cryptocurrency investments carry significant risk.

  • Navigating the Currents: Understanding and Interpreting Weak Sentiment in the Crypto Market

    Navigating the Currents: Understanding and Interpreting Weak Sentiment in the Crypto Market

    The cryptocurrency market, known for its exhilarating highs and precipitous lows, is fundamentally driven by investor psychology. While much attention is often paid to periods of "greed" and parabolic rallies, understanding "weak sentiment" – a pervasive mood of fear, pessimism, and uncertainty – is equally crucial for investors, projects, and the broader Web3 ecosystem. As of November 24, 2025, the principles of market sentiment remain a cornerstone of crypto analysis, offering vital clues into potential market bottoms, capitulation events, and the strategic shifts necessary for survival and growth.

    Weak sentiment signifies a collective lack of confidence, often leading to reduced demand, increased selling pressure, and a general "risk-off" attitude. This matters profoundly for the crypto ecosystem because, unlike traditional markets with deep-rooted fundamentals and extensive regulatory oversight, cryptocurrencies are highly susceptible to emotional swings. These periods act as stress tests, exposing vulnerabilities, flushing out unsustainable projects, and ultimately shaping the long-term trajectory of digital asset adoption and innovation.

    Market Impact and Price Action

    The most immediate and discernible effect of weak sentiment is a pronounced downward pressure on crypto asset prices. Fearful investors tend to liquidate their holdings, leading to widespread sell-offs that can quickly cascade into significant market corrections or even prolonged bear markets. This dynamic is particularly evident in the speculative crypto landscape, where price movements can sometimes defy fundamental analysis in favor of collective emotional reactions.

    During these downturns, trading volumes often present a mixed picture. Initially, high volumes may accompany sharp price declines, signaling panic selling and capitulation. However, if weak sentiment persists, trading volumes can thin out, indicating a lack of buying interest and hesitant market participation. This reduced liquidity exacerbates price swings, making assets more vulnerable to dramatic movements, as fewer buyers are available to absorb selling pressure. Historically, macroeconomic uncertainties and outflows from institutional investment vehicles, such as Bitcoin (NASDAQ: BITO) or Ethereum (NYSEARCA: ETHE) Exchange Traded Funds (ETFs), have been observed to further diminish liquidity.

    Technical analysis offers valuable insights into market psychology during periods of weak sentiment. Bearish candlestick patterns like the "Bearish Engulfing" or "Shooting Star" frequently emerge, signaling a shift from bullish to bearish momentum. Larger chart patterns such as "Head and Shoulders," "Double Tops," or "Descending Triangles" are classic indicators of impending or ongoing downtrends, suggesting exhausted buying power and increasing selling pressure. A "Death Cross," where a shorter-term moving average (e.g., 50-day) crosses below a longer-term one (e.g., 200-day), is a potent bearish signal often preceding significant market declines. Past "crypto winters," like that of 2018, or the market contraction following the FTX collapse in 2022, vividly illustrate how widespread weak sentiment, fueled by regulatory concerns or major market events, can trigger severe price depreciation and prolonged periods of low activity.

    Community and Ecosystem Response

    The crypto community's pulse during weak sentiment is palpable across social media platforms and discussion forums. The Crypto Fear & Greed Index typically plunges into "extreme fear" territory, reflecting widespread apprehension among retail investors. Discussions often become polarized, with some advocating "buying the dip" as a contrarian strategy, while others express "doom and gloom" scenarios, leading to intense debates about the market's future. This environment often sees reduced overall engagement, though highly emotive, fear-driven content can still spread rapidly, signaling mounting market pressure.

    Crypto influencers and thought leaders navigate these periods with varying approaches. Some may amplify the pessimistic mood, occasionally using giveaways to maintain engagement amidst falling prices. In contrast, more established thought leaders often adopt a long-term perspective, emphasizing market cycles, structural growth, and the importance of continued innovation. They typically urge developers to focus on building real value and utility, advocating for education and analytical thinking over impulsive emotional reactions. Figures like Robert Kiyosaki, for instance, consistently advise accumulating scarce assets like Bitcoin (NASDAQ: BITO) during downturns.

    The impact on related DeFi protocols is particularly severe due to their reliance on collateralized positions and interconnectedness. Widespread liquidations occur as collateral values fall, triggering "violent cascades" that exacerbate price plunges and lead to substantial forced selling. Reduced liquidity and investor deterrence plague the DeFi space, as increased volatility discourages participation in lending, borrowing, and yield farming. Similarly, the NFT market experiences a significant contraction, with sales volumes and average prices declining sharply. Projects are forced to shift from speculative "profile picture" (PFP) collections to developing tangible utility, with many struggling or ceasing operations. The broader Web3 application space also faces "innovation stagnation," with companies exposed to crypto assets experiencing valuation pressure and difficulties in raising capital. However, this downturn also fosters a shift towards quality-focused development, emphasizing fundamental infrastructure, security, and rigorous smart contract auditing, ultimately paving the way for more robust and resilient applications.

    What's Next for Crypto

    Weak sentiment, while challenging in the short term, plays a crucial role in the long-term maturation of the crypto industry. Short-term implications include continued selling pressure, elevated volatility, and a rotation into safer assets, with altcoins often experiencing deeper declines. Capital outflows from institutional products like Bitcoin (NASDAQ: BITO) and Ethereum (NYSEARCA: ETHE) ETFs are also common, signaling a broader risk-off environment.

    However, from a long-term perspective, bear markets are a natural, albeit painful, part of market cycles, often preceding new advances. They compel projects to prioritize sustainable development, focusing on real-world utility, robust technology, and strong community engagement. Bitcoin, in particular, continues to shed its purely speculative nature, increasingly being regarded as a long-term store of value. The growth in tokenized real-world assets (RWAs) also continues, laying groundwork for future expansion despite price volatility.

    Potential catalysts for a reversal of weak sentiment include a decline in U.S. dollar interest rates and easing global liquidity, making traditional assets less attractive. The establishment of clear and favorable regulatory frameworks in major economies could significantly boost confidence and attract more institutional investment. A sustained return of institutional inflows into major crypto assets, particularly through spot ETFs, would signal renewed confidence. Furthermore, continued technological advancements in scalability solutions and the scaled implementation of applications across DeFi, NFTs, and Web3 gaming would bolster utility and demand. Contrarian whale activity—aggressive accumulation by large holders during retail capitulation—has historically preceded market bottoms.

    For projects, strategic considerations during weak sentiment involve prioritizing real-world utility, fostering strong community engagement, maintaining lean operations, and adapting to evolving regulatory environments. Investors, on the other hand, should emphasize diversification and risk management, consider dollar-cost averaging (DCA), conduct thorough research (DYOR), and adopt a long-term perspective. Staying informed about macroeconomic developments and protecting assets through robust security measures are also paramount.

    Bottom Line

    Understanding weak crypto market sentiment is not merely about recognizing fear; it's about interpreting a critical phase in the market cycle that presents both challenges and strategic opportunities. For crypto investors and enthusiasts, the key takeaway is that weak sentiment is a recurring, natural part of the market's evolution. It serves as a necessary cleansing mechanism, filtering out speculative excesses and allowing projects with true utility and strong fundamentals to build and mature.

    The long-term significance of these periods lies in their ability to foster resilience and drive innovation, ultimately contributing to broader crypto adoption. While retail investors may retreat during downturns, growing institutional confidence, often driven by macroeconomic factors and increasing regulatory clarity, continues to anchor the market's long-term potential. This suggests a maturing asset class where larger, more stable entities see enduring value despite short-term fluctuations.

    To navigate these periods effectively, several important metrics should be monitored. The Fear and Greed Index offers a real-time gauge of market emotions. Social media sentiment analysis provides insights into community mood and FUD levels. Trading volume fluctuations, particularly during price movements, can signal market turning points. On-chain metrics such as Daily Active Addresses (DAA), whale movements, and supply trends offer fundamental insights into network health and accumulation patterns. Technical analysis indicators like moving averages and chart patterns can confirm trends and signal potential reversals. Finally, monitoring ETF inflows/outflows and broader macroeconomic factors (e.g., interest rates, inflation, central bank policies) is crucial, as these external forces heavily influence risk appetite and market direction. By adopting a disciplined, research-driven approach, investors can better understand and potentially capitalize on periods of weak crypto sentiment, positioning themselves for future growth.


    This article is for informational purposes only and does not constitute financial or investment advice. Cryptocurrency investments carry significant risk.

  • Bitcoin Teeters on the Brink: A Deep Dive into the $80,000 Support Level and Its Dire Implications

    Bitcoin Teeters on the Brink: A Deep Dive into the $80,000 Support Level and Its Dire Implications

    November 21, 2025 – The cryptocurrency market is gripped by a palpable sense of anxiety as Bitcoin (BTC) hovers precariously above the critical $80,000 support level. After a dramatic downturn throughout November, which saw the flagship cryptocurrency plummet approximately 35% from its all-time high of over $126,000 reached in October, BTC is currently trading in the low to mid-$80,000 range. This significant correction, marked by a 4.8% drop in the last 24 hours and a staggering 25.1% month-to-date decline, has ignited widespread fear and speculation across the digital asset landscape.

    The immediate market reaction has been one of heightened volatility and substantial liquidations, with over $1.9 billion wiped out in four hours and close to $2 billion in leveraged liquidations over the past day. The community is acutely aware that a decisive fall below $80,000 would not merely be a minor price adjustment, but a critical technical and psychological breakdown with potentially severe consequences for the entire crypto ecosystem. This moment is particularly significant as U.S. Bitcoin spot ETFs recorded substantial outflows of $903.2 million on November 21, signaling institutional caution amidst macroeconomic pressures and waning expectations for interest rate cuts from the U.S. Federal Reserve.

    Market Impact and Price Action

    Bitcoin's recent price movements have painted a grim picture for investors. Trading roughly between $81,668 and $87,038, with many reports indicating a price point around $82,000 to $83,000, BTC briefly dipped as low as $81,629 earlier on Friday. This sustained downward pressure has pushed the market into a state of "extreme fear," a sentiment reminiscent of the most challenging periods in crypto history. The current decline is further exacerbated by global events, including panic selling triggered by Japan's large-scale stimulus package, and an increase in holdings moved from dormant wallets to exchanges, suggesting profit-taking or risk aversion.

    From a technical analysis perspective, the $80,000 mark is far more than just a round number; it represents a confluence of significant psychological and technical support. Analysts are closely watching moving averages, Fibonacci retracement levels, and historical buying interest to gauge the strength of this support. A breach below this level would signal the failure of multiple technical foundations, implying a significant shift in market structure and sustained selling pressure. The price band between $89,600 and $79,500 is notably thin in terms of historical support, meaning fewer previous buying interests exist to defend these levels, potentially leading to a rapid decline if $80,000 is breached.

    Historically, the breakdown of such critical support levels has led to profound market effects. During the 2018 bear market, Bitcoin's decisive fall below the $6,000 support initiated a rapid capitulation, sending prices down to $3,200. Similarly, the March 2020 COVID-19 crash saw Bitcoin plunge from $8,000 to $3,800 in days, triggered by a global liquidity crisis. More recently, the May-July 2021 correction, influenced by regulatory concerns and environmental FUD, saw Bitcoin break below $40,000 and then $30,000, leading to significant sell-offs and a period of consolidation. These past instances consistently show that breaking major support levels accelerates price declines, increases volatility, and often ushers in periods of prolonged consolidation or deeper bear markets.

    The current environment, characterized by high trading volume during the dips and significant leveraged liquidations, suggests a strong conviction behind the selling pressure. A lack of decisive rebound above resistance levels like $90,000-$95,000 further confirms the persistent bearish sentiment. Should $80,000 fail, technical analysis suggests a potential path towards the $74,000-$76,000 range, aligning with April 2025 lows and the 161.8% Fibonacci extension level, with some even predicting a dip to $75,000.

    Community and Ecosystem Response

    The crypto community's response to Bitcoin's recent price action, especially as it flirts with $80,000, has been a mix of intense fear, speculation, and a steadfast "HODL" mentality. Social media platforms like X (formerly Twitter) and Reddit are awash with discussions ranging from panic selling and "bloodbath" narratives to calls for "buying the dip" and long-term optimism. The Crypto Fear & Greed Index, a widely followed sentiment indicator, has plunged deep into "Extreme Fear" territory, reflecting widespread apprehension among retail investors.

    Crypto influencers and thought leaders are largely divided. Many analysts acknowledge the bearish signals, warning of further downside and the potential for a prolonged bear market. However, a resilient segment, including prominent figures like Michael Saylor of MicroStrategy (NASDAQ: MSTR), often maintains an unwavering long-term bullish stance, viewing significant drops as strategic accumulation opportunities. Technical analysts are actively dissecting new support levels and historical patterns, while some thought leaders express frustration with market dynamics, arguing that speculative hype often overshadows genuine technological advancements.

    The ripple effects of Bitcoin's downturn are profoundly felt across the broader crypto ecosystem. Decentralized Finance (DeFi) protocols are particularly vulnerable, experiencing widespread liquidations as collateral values fall below predefined thresholds. This algorithmic liquidation process can trigger "violent cascades," exacerbating price plunges and leading to billions of dollars in forced selling. Reduced liquidity and investor deterrence also plague the DeFi space, as the volatility discourages engagement in lending, borrowing, and yield farming.

    The NFT market, highly correlated with Bitcoin, is also facing a significant contraction. Sales volumes and average prices for most NFT collections are declining sharply as speculative interest wanes. While "blue-chip" NFTs might show comparative resilience, the overall market is struggling, with investors shifting towards more "productive" crypto assets or those with perceived real-world utility. Web3 applications, especially those in early development, face immense funding challenges as venture capital dries up, forcing a renewed focus on fundamental utility and technological advancements rather than hype-driven narratives.

    What's Next for Crypto

    The immediate future for the crypto market, particularly if Bitcoin breaches $80,000, appears challenging. Short-term implications include widespread altcoin declines, with many already shedding 50% to 70% of their value. A breach of $80,000 would likely accelerate this capitulation, intensifying the "extreme fear" sentiment and leading to further cascading liquidations in the derivatives market. Reduced liquidity and trading volumes would also make assets more susceptible to large price swings, creating a volatile environment.

    However, the long-term outlook is more nuanced. Some analysts suggest that Bitcoin's historical four-year cycle may be extending, with the next peak potentially occurring in 2026 rather than 2024-2025, driven by macroeconomic factors. This current downturn could be a "reallocation of chips" in the mid-stage of a bull market, setting the stage for a "reboot point" in 2026 as global monetary policy shifts towards easing. Institutional interest, despite short-term volatility, remains a strong long-term driver, with a significant price drop potentially viewed as a buying opportunity by large players.

    Several potential catalysts could influence the market's trajectory in late 2025 and 2026. Macroeconomic factors, such as anticipated interest rate cuts by central banks from late 2025 into mid-2026 and a weakening U.S. Dollar Index (DXY), could inject liquidity and encourage investment in higher-yielding assets like cryptocurrencies. Regulatory clarity, particularly in the U.S. with a potentially more crypto-friendly administration and stablecoin legislation, could build investor confidence. Technological advancements, including the tokenization of real-world assets (RWAs), growth in DeFi and Layer 2 solutions, and the integration of AI and machine learning, are expected to drive new use cases and demand.

    For projects and investors, strategic considerations are paramount. Projects should prioritize utility, scalability, robust compliance, and integration of AI. Investors are advised to adopt dollar-cost averaging (DCA), diversify portfolios, utilize stablecoins to protect capital, and "buy the dip" cautiously with a long-term perspective. Possible scenarios include a further decline to $60,000 or even $40,000-$45,000, a period of consolidation and bottoming out, or a eventual bounce back and recovery, potentially leading to a new bull run in 2026 with Bitcoin reaching $150,000-$200,000. The likelihood of an extended bear market is currently considered significant, but a strong recovery in 2026 is also a plausible outcome given anticipated macroeconomic shifts.

    Bottom Line

    The current situation for Bitcoin, flirting with the $80,000 support level, presents a critical juncture for the entire cryptocurrency market. Key takeaways for investors and enthusiasts include the recognition of $800,000 as a vital technical and psychological benchmark, the potential for accelerated declines and cascading liquidations if breached, and the pervasive "extreme fear" sentiment gripping the market. The short-term outlook is undoubtedly challenging, with significant volatility and potential for further price depreciation across altcoins.

    However, the long-term significance of this period lies in its potential to act as a stress test for the ecosystem, weeding out weaker projects and forcing a renewed focus on fundamental utility and robust compliance. While a fall below $80,000 would signal considerable short-term pain, it could also set the stage for a more mature and resilient market, especially with anticipated macroeconomic tailwinds and continuous technological innovation.

    Important metrics to monitor include institutional ETF flows, global interest rate policies, regulatory developments, and on-chain metrics related to long-term holder behavior. While the current environment is fraught with uncertainty, the crypto market's historical resilience and its ongoing evolution suggest that even significant downturns can ultimately pave the way for future growth and broader adoption.


    This article is for informational purposes only and does not constitute financial or investment advice. Cryptocurrency investments carry significant risk.

  • Bitcoin Holds the Line: A Deep Dive into the $100K-$105K Consolidation and What’s Next for Crypto in Late 2025

    Bitcoin Holds the Line: A Deep Dive into the $100K-$105K Consolidation and What’s Next for Crypto in Late 2025

    As of November 12, 2025, Bitcoin (BTC) is navigating a pivotal phase, firmly establishing a new trading range between $100,000 and $105,000. This sustained consolidation follows a remarkable year that saw the flagship cryptocurrency breach the six-figure mark and even touch new all-time highs above $126,000 in early October. The market's immediate reaction has been a mix of cautious optimism and strategic positioning, as investors and analysts alike grapple with the implications of Bitcoin's newfound stability at these elevated levels.

    This period is critical for the broader crypto ecosystem. Bitcoin's ability to hold ground above the psychological $100,000 barrier, despite recent dips and macroeconomic headwinds, signals a significant maturation of the asset class. It underscores the growing influence of institutional capital, particularly through the sustained impact of Bitcoin Exchange-Traded Funds (ETFs), and sets a new benchmark for digital asset valuations as the industry moves further into mainstream finance.

    Market Impact and Price Action

    Bitcoin's journey to and around the $100K-$105K range in late 2025 has been dynamic. After first breaching $100,000 in December 2024, BTC soared to a new all-time high of approximately $123,000 in July 2025, and later touched $126,210 in early October. However, a subsequent correction saw it consolidate near $106,800 in late October and around $104,000-$104,679 in early November. This $100,000 level has proven to be a crucial psychological and technical support zone, attracting significant buying demand and acting as a floor during pullbacks.

    Trading volume has presented mixed signals. While overall trade volume remains substantial, there's been a noted decrease in transaction count alongside an increase in total transaction volume, suggesting larger, institutional-scale fund movements. Market volatility, after a period of consolidation, surged by 41% after September 2025. Open interest in derivatives has also seen a significant reset, clearing speculative froth and potentially leading to fragile liquidity in the short term.

    From a technical analysis perspective, key support levels are identified around $100,700-$104,100, with stronger zones at $100,000, $106,400, $106,900, $110,000-$112,000, and the 200-day Simple Moving Average (SMA) around $103,200. Crucial resistance levels include $109,400-$112,400, $115,000, $117,000-$119,000, and the all-time high of $126,210. Predictions for the rest of 2025 vary, with some analysts expecting a dip to $100,000 before a rally towards $120,000. A bullish outlook for Q4 2025, driven by structural and event-driven catalysts, projects Bitcoin reaching $120,000-$140,000 by December, with more aggressive forecasts even suggesting $150,000-$200,000 if bullish patterns play out.

    The impact of Bitcoin ETF inflows has been profound. After an initial surge in 2024, 2025 saw a decline in institutional demand, with inflows to major spot BTC ETFs dropping by as much as 90%. This reduced buying pressure contributed to price corrections in late October and early November. However, early November showed signs of recovery, with U.S. spot Bitcoin ETFs ending a six-day outflow streak with $240 million in inflows, leading to price stabilization. Notably, BlackRock's (NYSE: BLK) IBIT ETF alone captured about 50% of these inflows. Cumulatively, U.S. Bitcoin ETFs have registered over $60.3 billion in net inflows since launch, demonstrating strong long-term retention of institutional capital and absorbing a significant portion of Bitcoin's supply, reinforcing its structural strength above $100,000.

    Community and Ecosystem Response

    The crypto community's response to Bitcoin's $100K-$105K consolidation in late 2025 is a tapestry of cautious optimism, intense debate, and strategic recalibration. Following a brief dip below $100,000, the Crypto Fear & Greed Index briefly plummeted to "extreme fear," reflecting retail investor apprehension. However, discussions across social media platforms like Twitter and Reddit quickly pivoted, with many viewing the dip as a prime "buy-the-dip" opportunity, underscoring the community's underlying belief in Bitcoin's long-term trajectory.

    Crypto influencers and thought leaders present a divided but generally positive outlook. While some, like Bloomberg's Mike McGlone, suggest potential downsides, others, such as MicroStrategy (NASDAQ: MSTR) founder Michael Saylor, express strong confidence that Bitcoin will not fall significantly below current levels. Analysts from Standard Chartered (LON: STAN) maintain a bullish stance, projecting Bitcoin to rally to $200,000 by year-end, partly due to anticipated pro-crypto policies. This "cautious optimism" is a recurring theme, acknowledging short-term volatility while emphasizing long-term growth potential.

    The effects on related sectors are tangible. DeFi protocols have seen some decline in Total Value Locked (TVL) due to price uncertainty and contagion fears in lending markets. However, the Bitcoin DeFi (BTCFi) ecosystem is rapidly expanding, with institutional adoption via Bitcoin ETFs expected to reinvigorate the entire crypto sector, spurring interest in Bitcoin-based DeFi services like staking ETFs. The NFT market has experienced decreased trading volumes, reflecting a "risk-off" environment, but is simultaneously shifting towards utility-focused applications, with NFT gaming gaining traction. Web3 applications have observed a temporary dip in user engagement, but Bitcoin's sustained hold above $100,000 is seen as a "green light for riskier bets," driving significant investment into Bitcoin Layer-2 solutions crucial for smart contract functionality and a decentralized financial ecosystem built around BTC.

    What's Next for Crypto

    Bitcoin's consolidation around $100K-$105K in late 2025 heralds a new era for the crypto market, characterized by increased institutionalization and a focus on sustainable growth.

    In the short-term (late 2025 – early 2026), Bitcoin's stability could lead to "altcoin momentum" as liquidity potentially flows into other digital assets. Increased institutional participation, particularly through spot Bitcoin and Ethereum ETFs, will continue to shape market dynamics, shifting from retail-driven volatility to institutional-grade liquidity. The market will remain highly sensitive to macroeconomic factors, with lower inflation and anticipated interest rate cuts by central banks expected to inject liquidity and potentially fuel altcoin rallies. Evolving regulatory frameworks globally, like the US "GENIUS Act" for stablecoins and the "CLARITY Act" for digital assets, are crucial for fostering institutional confidence.

    Long-term (beyond 2026), the trend of institutions, corporations, and even governments viewing crypto as a serious asset is expected to accelerate. The stablecoin market is projected to reach $10 trillion within 2-3 years, and more treasury companies will likely hold cryptocurrencies. Bitcoin's resilience positions it as a strategic reserve asset, with Deutsche Bank (NYSE: DB) predicting central banks adding BTC to their reserves by 2030. The 2024 Bitcoin halving, which reduced mining rewards, will continue to drive scarcity, with long-term projections for Bitcoin by 2030 ranging from $250,000 to $1 million.

    Potential catalysts include further regulatory advancements, such as the "BITCOIN Act" in the US potentially establishing a path for government Bitcoin acquisition, and the continued implementation of global frameworks like the EU's MiCA regulation. Institutional product expansion will see anticipation for spot altcoin ETFs (e.g., Solana, XRP) and Ethereum staking ETFs. Technological innovations like Ethereum's Pectra upgrade, AI-powered crypto solutions, cross-chain interoperability, and Decentralized Physical Infrastructure Networks (DePIN) will drive new use cases and investor interest. Finally, macroeconomic shifts, including global liquidity trends and central bank interest rate policies, will continue to exert significant influence.

    For projects, strategic considerations include rigorous regulatory compliance, a strong focus on utility and innovation (especially in DeFi, tokenized assets, and AI-crypto integrations), and strategic partnerships bridging traditional and decentralized finance. Investors should prioritize diversification, robust risk management, and staying informed about regulatory and macroeconomic developments. While short-term trading opportunities exist, dollar-cost averaging and long-term holding remain advisable strategies.

    Possible scenarios for Bitcoin's price for the remainder of 2025 include:

    • Sustained Consolidation followed by an Upward Breakout (Moderate to High Likelihood): Bitcoin remains range-bound between $100K and $115K before a decisive move towards $120K-$150K, supported by institutional inflows and regulatory clarity.
    • Temporary Dip Below $100K before Recovery (Moderate Likelihood): Bitcoin briefly revisits levels below $100,000 (e.g., $95K-$90K) due to profit-taking or external events, but quickly rebounds due to strong institutional demand.
    • Prolonged Bearish Downturn (Low Likelihood): A significant and sustained drop below $100,000, triggered by severe negative macroeconomic shifts or restrictive global regulations, is currently considered less likely based on prevailing sentiment.

    Bottom Line

    Bitcoin's unwavering stance around the $100,000-$105,000 mark in late 2025 is more than just a price point; it's a testament to its evolving role as a legitimate, institutional-grade asset. This consolidation phase signifies a new market baseline, demonstrating the asset class's growing maturity and resilience against various market pressures. For crypto investors and enthusiasts, the key takeaways are clear: Bitcoin has cemented its status as a strategic asset, a hedge against economic uncertainty, and a cornerstone of diversified portfolios. While volatility remains a constant companion, the long-term outlook is overwhelmingly positive, driven by sustained institutional validation and strategic accumulation by "whales."

    The long-term significance of this period cannot be overstated. It sets a new psychological and technical foundation for Bitcoin's valuation, propelling it further into mainstream acceptance. This, in turn, acts as a powerful catalyst for broader crypto adoption, making digital assets more accessible through regulated avenues like ETFs and encouraging their integration into corporate treasuries and even national reserves. The expansion of stablecoins for transactional roles further solidifies Bitcoin's primary function as a robust store of value.

    Moving forward, several important dates, events, and metrics warrant close monitoring. Investors should keep a keen eye on macroeconomic indicators, particularly U.S. government stability, Federal Reserve interest rate policies, and inflation reports. Crucially, tracking Bitcoin ETF inflows and outflows, corporate accumulation strategies, and on-chain data like exchange outflow ratios and long-term holder supply will provide invaluable insights into institutional sentiment. From a technical perspective, watching key support and resistance levels (especially around $100,000, $105,000, and $110,000), along with moving averages and momentum indicators, will be essential. Finally, continued progress in global regulatory clarity will remain a pivotal factor in fostering further institutional and mainstream adoption. By diligently monitoring these multifaceted indicators, market participants can navigate Bitcoin's significant position in late 2025 and its profound implications for the future of the digital asset landscape.


    This article is for informational purposes only and does not constitute financial or investment advice. Cryptocurrency investments carry significant risk.

  • Decoding Bitcoin’s Future: How Technical Indicators, Especially MVRV, Pinpoint Market Extremes

    Decoding Bitcoin’s Future: How Technical Indicators, Especially MVRV, Pinpoint Market Extremes

    November 6, 2025 – In the volatile realm of cryptocurrency, predicting price movements remains a holy grail for investors. As Bitcoin (BTC) continues to mature, a sophisticated arsenal of technical indicators has emerged as critical tools for navigating its often-unpredictable cycles. Among these, the Market Value to Realized Value (MVRV) ratio stands out as a particularly potent on-chain metric, offering profound insights into investor sentiment and historically signaling potential market bottoms and tops. This analytical framework provides a data-driven lens through which traders and long-term holders alike can identify periods of significant overvaluation or undervaluation, helping to de-risk investment strategies and optimize entry and exit points.

    The ongoing discussion around the efficacy of technical analysis in a relatively nascent asset class like crypto underscores its growing importance. As market participants become more sophisticated, the reliance on these indicators has intensified, shaping immediate trading reactions and influencing broader community sentiment. Understanding how tools like MVRV function is not just an academic exercise; it's a fundamental requirement for anyone looking to navigate the complex currents of the digital asset economy, providing a crucial framework for interpreting Bitcoin's cyclical nature and its implications for the wider crypto ecosystem.

    Market Impact and Price Action

    The interplay between Bitcoin's price action and various technical indicators offers a powerful lens for understanding market dynamics. While traditional metrics like Moving Averages (MAs), the Relative Strength Index (RSI), and MACD provide insights into momentum and trend strength, on-chain indicators like MVRV offer a deeper look into the underlying investor psychology and valuation.

    Moving Averages, for instance, are fundamental for identifying trends; a sustained move above the 200-day MA typically signals a bullish long-term outlook, while a drop below it often indicates bearish sentiment. The RSI, a momentum oscillator, helps identify overbought (above 70) or oversold (below 30) conditions, often preceding price corrections or rallies. Similarly, MACD crossovers are closely watched for shifts in momentum, with a bullish cross suggesting upward pressure and a bearish cross indicating potential declines. Trading volume is equally crucial, as significant price movements accompanied by high volume lend credibility to the trend, confirming strong conviction from market participants. Conversely, price changes on low volume are often viewed with skepticism, suggesting a lack of broad market participation.

    The MVRV ratio, however, provides a unique valuation perspective by comparing Bitcoin's market capitalization to its realized capitalization (the sum of all coins valued at their last on-chain movement). A high MVRV ratio, typically above 3, suggests that Bitcoin's market value significantly exceeds the aggregate cost basis of its holders, implying substantial unrealized profits across the network. Historically, such elevated readings have coincided with periods of overvaluation and increased selling pressure, preceding major market tops. For example, during the parabolic 2017 bull run, the MVRV ratio soared to 4.72 in December, signaling an overheated market just before Bitcoin's price peaked around $20,000. Similarly, in the spring of 2021, the MVRV ratio reached 3.96, and its Z-Score (a standardized version) exceeded 7, again flashing warning signs of an impending correction.

    Conversely, a low MVRV ratio, particularly below 1, indicates that Bitcoin's market value is less than its realized value, meaning a significant portion of holders are experiencing unrealized losses. These periods typically mark undervaluation and have historically aligned with market bottoms, presenting opportune times for accumulation. The depths of the 2018 bear market saw the MVRV Z-Score plummet to -0.49 in December, signaling extreme undervaluation as Bitcoin bottomed out around $3,400. The infamous COVID-19 crash in March 2020 also saw the MVRV Z-Score dip sharply into the "green zone" of undervaluation, marking a significant buying opportunity before a robust recovery. More recently, during the mid-2022 bear market, the MVRV Z-Score again entered this green zone, signaling a potential price bottom amidst widespread capitulation. These historical correlations underscore MVRV's efficacy as a macro oscillator, guiding investors through Bitcoin's boom and bust cycles.

    Community and Ecosystem Response

    The crypto community's engagement with technical indicators, particularly on-chain metrics like the MVRV ratio, is robust and increasingly sophisticated. From seasoned analysts to retail investors, these tools are widely discussed across social media platforms like Crypto Twitter and Reddit, serving as a common language for interpreting market cycles. Influencers and thought leaders, such as Benjamin Cowen of Into The Cryptoverse, frequently integrate MVRV analyses into their market commentary, sparking extensive debates and shaping collective sentiment.

    The general consensus among the community regarding MVRV's effectiveness is largely positive. It is widely regarded as a powerful tool for assessing Bitcoin's "fair value" and identifying potential market tops and bottoms. Its historical accuracy in signaling major cycle extremes, often within weeks of actual peaks or troughs, has solidified its reputation. However, this positive sentiment is tempered by a pragmatic understanding of its limitations. Analysts consistently emphasize that MVRV should not be used in isolation but rather as part of a comprehensive analytical framework, combined with other on-chain data, traditional technical analysis, and fundamental research. There's also a growing awareness of "cyclical decay," where the MVRV peak values near cyclical tops have been decreasing over time, suggesting that speculative extremes might be dampening as the market matures.

    While DeFi protocols, NFT projects, and broader Web3 applications don't "react" to MVRV analyses in a programmatic sense, their ecosystems are profoundly influenced by the market sentiment and investor behavior that these indicators help predict. During periods of high MVRV, signaling potential market tops and impending corrections, these projects may experience reduced liquidity, decreased user engagement, and a "flight to quality" within the NFT space, where only the most robust and innovative collections retain value. Conversely, when MVRV signals undervaluation and potential market bottoms, these ecosystems often enter a "building phase," with developers focusing on core infrastructure, product development, and long-term value propositions, anticipating renewed interest and adoption during the subsequent bull market. The underlying health of these sectors is intrinsically linked to the broader market cycles, making MVRV a critical metric for strategic planning and risk management across the entire Web3 landscape.

    What's Next for Crypto

    The utility of technical indicators like MVRV extends beyond historical analysis, offering crucial insights into the short and long-term trajectory of the crypto market. As of November 2025, Bitcoin's MVRV ratio hovering around 1.8 suggests a "mid-cycle expansion" or an "opportunity zone," indicating that the market is currently in an accumulation phase rather than a state of euphoric overvaluation. This implies potential for further rallies, but also signals that investors should remain vigilant for shifts in sentiment.

    In the short term, MVRV will continue to serve as a bellwether for market sentiment. A rapid ascent of the MVRV ratio above 3 or 3.7 would signal increasing overvaluation and potential profit-taking, while a drop below 1 would suggest capitulation and potential buying opportunities. The MVRV Z-Score, in particular, will be closely watched for extreme deviations, with values above 7 historically flagging speculative tops and negative values indicating undervaluation.

    Looking further ahead, several catalysts are poised to shape the crypto landscape:

    1. Regulatory Clarity and Expansion: The full implementation of the European Union's Markets in Crypto-Assets (MiCA) regulation in December 2024 has set a precedent for standardized crypto regulation. The approval of spot Bitcoin and Ethereum (ETH) ETFs in 2024 has already brought significant institutional capital into the market. Future approvals for other major cryptocurrencies like Solana (SOL) and XRP (XRP) by late 2025 could further expand institutional access and demand. Pro-crypto political sentiments, especially in key jurisdictions, could also lead to more favorable banking regulations for crypto-engaged financial institutions.
    2. Technological Advancements: Continued progress in Layer 2 scaling solutions (e.g., Arbitrum, Optimism, zkSync) will enhance transaction speed and reduce costs, improving the overall user experience. The tokenization of Real-World Assets (RWAs) is gaining significant institutional traction, projected to unlock substantial liquidity and streamline transactions. The convergence of AI and blockchain, with AI systems validating on-chain data and automating smart contracts, is expected to expand Web3 utility beyond traditional DeFi.
    3. Institutional Adoption: The increasing integration of crypto products and services by major companies, banks, and financial institutions will continue to legitimize the asset class, attracting more mainstream investment. This influx of institutional capital is expected to deepen market liquidity and stability, potentially shifting Bitcoin's price dynamics away from its historical "four-year cycles" towards more gradual, sustained growth.
    4. Macroeconomic Environment: Global monetary policies will remain a critical factor. Expansionary policies (lower interest rates, quantitative easing) tend to favor risk assets like crypto, while tightening policies can induce downturns. Bitcoin's role as a potential hedge against inflation and currency devaluation in economically unstable regions will also continue to drive adoption.

    For projects, the strategic imperative is to focus on developing real-world utility, robust technology, and regulatory compliance. Projects that can seamlessly integrate with AI, tokenize valuable assets, and adhere to evolving regulatory frameworks like MiCA will be best positioned for long-term success.

    For investors, strategic considerations revolve around risk management, informed decision-making, and a long-term perspective. Diversification across various cryptocurrencies and traditional assets is crucial. Leveraging indicators like MVRV as one component of a broader analytical toolkit, rather than a standalone signal, will be key. While short-term volatility is expected to persist, a long-term "buy-and-hold" strategy, potentially combined with dollar-cost averaging, can help navigate market fluctuations and capitalize on crypto's growth potential.

    Possible scenarios for the crypto market in the near future include:

    • Bullish Scenario (Moderate to High Likelihood): Continued institutional inflows, favorable regulatory developments, and technological advancements could propel Bitcoin towards new all-time highs, with some analysts predicting targets of $150,000 in 2025 and potentially $250,000-$700,000 by 2030. The MVRV ratio at 1.8 suggests an accumulation phase, historically a precursor to rallies.
    • Neutral/Stagnation Scenario (Moderate Likelihood): The market could experience range-bound consolidation, with Bitcoin trading within a defined range (e.g., $104,000-$116,000), as investors await clearer catalysts or regulatory clarity.
    • Bearish Scenario (Moderate Likelihood): A hawkish shift in central bank policies, escalating geopolitical conflicts, or major security breaches could trigger a prolonged downturn or "crypto winter," similar to past cycles.

    The most likely path involves continued growth, albeit with intermittent periods of volatility and consolidation, as the market matures and integrates further into the global financial system.

    Bottom Line

    For crypto investors and enthusiasts, a nuanced understanding of technical indicators is paramount for navigating the inherent volatility of digital assets. The MVRV ratio, in particular, stands out as a powerful on-chain metric for identifying macro market tops and bottoms, acting as a crucial contrarian indicator that helps distinguish between speculative fervor and genuine undervaluation. Its long-term significance lies in its ability to consistently signal periods of market euphoria and capitulation, guiding investors through Bitcoin's cyclical nature.

    The increasing reliance on MVRV and other sophisticated on-chain analytics points to a maturing crypto market, fostering greater institutional integration and supporting broader crypto adoption. As the market evolves, robust data-driven tools empower investors to make more informed decisions, moving beyond pure speculation towards a more analytical approach. The growing utility of stablecoins for real-world transactions and the increasing number of mobile wallet users further underscore the expanding practical adoption of cryptocurrencies.

    Key takeaways for investors include:

    • Diversify your portfolio: Never rely on a single indicator or asset.
    • Risk management is crucial: Invest only what you can afford to lose.
    • Combine indicators: Use MVRV in conjunction with other technical and fundamental analyses for a holistic view.
    • Long-term perspective: "Time in the market" often outperforms "timing the market."

    Important metrics and events to monitor include:

    • MVRV Ratio and MVRV Z-Score: Continuously track these for signals of overvaluation (e.g., MVRV > 3.7) or undervaluation (e.g., MVRV < 1).
    • Bitcoin Halving: The next halving is expected in 2028, historically preceding bull markets.
    • Regulatory Developments: Keep an eye on global regulatory frameworks (e.g., MiCA) and spot ETF approvals for other cryptocurrencies.
    • Network Activity: Monitor active addresses, transaction counts, and total value locked (TVL) in DeFi for signs of organic growth.
    • Macroeconomic Indicators: Central bank policies, inflation data, and global liquidity trends will continue to influence risk asset markets.
    • Institutional Inflows: Track capital flows into crypto ETFs and other institutional products as a measure of mainstream adoption.

    By diligently monitoring these factors and adopting a well-researched, long-term strategy, investors and enthusiasts can gain a more comprehensive understanding of market conditions and make more informed decisions in this rapidly evolving space.


    This article is for informational purposes only and does not constitute financial or investment advice. Cryptocurrency investments carry significant risk.

  • Bitcoin’s $100,000 Crossroads: MVRV Indicator Signals Local Bottom Amidst Market Volatility

    Bitcoin’s $100,000 Crossroads: MVRV Indicator Signals Local Bottom Amidst Market Volatility

    November 6, 2025 – The cryptocurrency market is abuzz as Bitcoin (BTC) navigates a critical juncture around the psychologically significant $100,000 mark. On-chain analytics, particularly the Market Value to Realized Value (MVRV) indicator, are strongly suggesting that Bitcoin is currently forming a local bottom, signaling a potential accumulation phase for investors. This comes after a period of intense volatility, where the world's leading cryptocurrency dipped below $100,000 for the first time since June, triggering a wave of both anxiety and strategic positioning across the crypto ecosystem.

    The MVRV ratio, a cornerstone in on-chain analysis, compares Bitcoin's current market capitalization to its realized capitalization (the aggregate price at which each coin last moved). A low MVRV ratio, especially when entering an "opportunity zone," historically indicates undervaluation and often precedes significant price recoveries. As of November 6, 2025, with Bitcoin trading around $100,780, the MVRV ratio has dipped to levels not seen since April 2025, suggesting that selling pressure may be nearing exhaustion. This development is crucial for investors, as it provides a data-driven perspective on market cycles, helping to discern genuine accumulation opportunities from speculative noise. The immediate market reaction has been a mix of cautious optimism from long-term holders and renewed fear among short-term traders, setting the stage for a potentially pivotal period for Bitcoin and the broader digital asset landscape.

    Market Impact and Price Action

    Bitcoin's journey around the $100,000 threshold in late 2025 has been nothing short of a rollercoaster, demonstrating both the asset's newfound maturity and its inherent volatility. After reaching record highs above $100,000 earlier in the year, a correction saw Bitcoin (BTC) briefly touch below this key level in early November. This dip was accompanied by a notable increase in liquidations of leveraged long positions, suggesting a flush-out of over-optimistic traders. Despite this, the MVRV indicator, alongside the 50-week Exponential Moving Average (EMA) which hovers near $100,000, has reinforced this area as a critical structural floor.

    Earlier in September 2025, analytics firm Santiment observed Bitcoin's 30-day MVRV ratio dipping below zero, indicating that recent buyers were at a loss—a condition that has historically signaled an accumulation phase. This pattern re-emerged as Bitcoin tested support between $100,000 and $101,400 following a Federal Reserve announcement-induced decline. Trading volume around these levels has been significant, indicating strong market interest and a battle between buyers and sellers. While institutional interest, particularly in Bitcoin Exchange Traded Funds (ETFs), has remained robust with net inflows, retail investor sentiment has shown signs of weakening during dips.

    Comparing this to past MVRV-signaled bottoms, such as the 2018 bear market bottom, the March 2020 "Black Thursday" crash, or the mid-2022 bear market, the MVRV ratio dipped significantly below 1 in those instances, indicating extreme undervaluation. While the current MVRV reading for Bitcoin around $100,000 (reportedly around 1.8, the lowest since April 2025) is not as extreme as previous capitulation events, it still firmly places Bitcoin in an "opportunity zone." Historically, periods where MVRV climbed back above 1 after a dip have heralded market recoveries, suggesting that the current consolidation around $100,000 could be a similar precursor to an upward trend, albeit potentially less dramatic than post-capitulation rallies.

    Community and Ecosystem Response

    The crypto community's response to Bitcoin's dance around $100,000 in late 2025 has been a microcosm of market sentiment—a blend of "Extreme Fear" and unwavering long-term conviction. Social media platforms like Crypto Twitter and Reddit are rife with discussions, with the Crypto Fear & Greed Index reflecting widespread despair over "nonstop selling" and uncertainty about recovery. While some users on r/CryptoCurrency debate Bitcoin's "underpriced" status, others express cynicism, comparing the market to a "casino."

    Crypto influencers and thought leaders, however, often present a more nuanced view. Many point to the MVRV indicator's suggestion of a "local bottom" or "undervaluation phase" as a strategic buying opportunity. For instance, Standard Chartered (LSE: STAN) predicted in mid-October 2025 that any dip below $100,000 would be a significant "buying opportunity," potentially "the last time Bitcoin is EVER below 100k," maintaining an aggressive year-end target of $200,000. Prominent figures like Michael Saylor, CEO of MicroStrategy (NASDAQ: MSTR), continue to advocate for accumulation during dips, reinforcing a long-term bullish stance. Mike Novogratz, CEO of Galaxy Digital (TSE: GLXY), also suggested Bitcoin would likely hold above this support. Analysts from CryptoQuant, while acknowledging the MVRV signal, also cautioned that a failure to hold $100,000 could lead to further declines towards $72,000.

    The "risk-off" sentiment impacting Bitcoin has naturally rippled through the broader ecosystem. Ethereum (ETH), the backbone of much of Decentralized Finance (DeFi), has experienced pressure, though the Total Value Locked (TVL) in DeFi shows signs of recovery, indicating resilience. Decentralized exchange (DEX) trading volumes are still projected to exceed $4 trillion by 2025, fueled by AI-related tokens and new dApps. The NFT market, after a challenging 2024, is also expected to rebound in 2025, with Ethereum maintaining dominance. Web3 applications are evolving, with AI agents' on-chain activity predicted to surpass 1 million, expanding utility beyond DeFi. While traders currently favor the stability of large-cap cryptocurrencies like Bitcoin during consolidation, the long-term outlook for innovative Web3 sectors remains positive, especially with renewed institutional interest.

    What's Next for Crypto

    The MVRV indicator's suggestion of a local Bitcoin bottom near $100,000 in late 2025 carries significant implications for the crypto market's trajectory from November 2025 onwards. Historically, an MVRV ratio entering the 1.8-2.0 range, as seen currently, often signals a mid-term market bottom or an early recovery phase. This implies that the market is likely entering an accumulation phase, a precursor to potential price rallies. Short-term, volatility is expected to persist, influenced by macroeconomic factors and ETF flows. However, if historical patterns hold, Bitcoin could see a recovery of approximately 50%, potentially reaching $150,000, driven by consolidation and rebalancing.

    Long-term, the outlook for institutional crypto adoption remains robust. The period from 2024-2026 is viewed as an era of significant institutional integration, with large financial entities and even nation-states increasingly adopting digital assets. This sustained interest is expected to deepen market liquidity and stability, potentially shifting Bitcoin away from its traditional "four-year cycle" towards more gradual, sustained growth. Optimistic long-term predictions for Bitcoin by 2030 range from $250,000 to $700,000.

    Several catalysts and developments are poised to shape this future:

    1. Institutional Adoption: The success of spot Bitcoin ETFs continues to attract substantial inflows, with forecasts of $120 billion by year-end 2025 and $300 billion in 2026. The integration of Bitcoin into 401(k) retirement plans and increasing financial advisor recommendations will further accelerate this trend.
    2. Regulatory Clarity: Global regulatory frameworks are rapidly evolving. The US "GENIUS Act" established a comprehensive framework for payment stablecoins in July 2025, while the EU's MiCAR is in effect. The UK and Asian regions like Hong Kong and Singapore are also implementing clear crypto regulations, fostering greater institutional confidence.
    3. Technological Advancements: The tokenization of real-world assets (RWAs) is accelerating, growing to over $21 billion by April 2025. The development of complex Bitcoin-related financial products and permissioned DeFi for institutional use will expand the market's capabilities.
    4. Post-Halving Dynamics: While the latest halving was in April 2024, its effects continue to unfold, reducing new Bitcoin supply and supporting an extended accumulation zone.

    For investors, this period suggests an opportune time for long-term accumulation, potentially through Dollar-Cost Averaging (DCA). Strategic considerations include avoiding excessive leverage, diversifying portfolios, and holding stablecoins for liquidity. Projects should focus on fundamentals, regulatory compliance, and innovation in areas like RWA tokenization. Possible scenarios include a high-likelihood bullish resurgence towards new all-time highs, a moderate-likelihood consolidation with gradual growth, or a low-likelihood extended volatility with stagnation, given the current MVRV signal and institutional momentum.

    Bottom Line

    The MVRV indicator's signal of a local Bitcoin bottom near $100,000 in early November 2025 is a critical takeaway for crypto investors and enthusiasts. It suggests that despite recent market volatility and a dip below this key psychological level, Bitcoin is currently in an "opportunity zone" for accumulation, where selling pressure may be nearing exhaustion. This aligns with historical patterns where low MVRV values have often preceded significant market recoveries, making it a potentially strategic entry point for long-term investors.

    The long-term significance of this signal for crypto adoption is profound. Bitcoin's ability to find strong support at a six-figure valuation, even after experiencing corrections, underscores its increasing resilience and the maturation of the broader market. This resilience, coupled with sustained institutional confidence evident in ETF inflows and growing regulatory clarity, is paving the way for wider, more informed adoption. The MVRV indicator helps to establish a "fair value" framework for Bitcoin, moving it beyond purely speculative narratives and fostering a more data-driven approach to crypto investing.

    Final thoughts on what this means for the broader crypto market point to a cautiously optimistic outlook. If Bitcoin can sustain support above $100,000 and rebound towards the projected higher targets of $160,000 to $200,000 by late 2025 or 2026, it could ignite renewed bullish momentum across altcoins and the entire digital asset ecosystem. However, the market remains susceptible to macroeconomic factors, regulatory developments, and broader sentiment. The ongoing integration of AI into crypto also presents transformative forces, both in terms of innovation and potential volatility.

    Important Dates, Events, or Metrics to Monitor from November 2025 Onwards:

    • On-Chain Metrics: Continue monitoring the MVRV Ratio and MVRV Z-Score for confirmation of bottom strength and market sentiment. Track Realized Price of Short-Term Holders (STH RP) and Long-Term Holders (LTH RP), with STH RP around $113,000 being a key level to watch.
    • ETF Inflows/Outflows: Monitor net flows into spot Bitcoin ETFs, as sustained inflows signal institutional demand.
    • Macroeconomic Data: Key releases include US Labor Data (around November 7, 2025), CPI & Core CPI (October's inflation data, around November 13, 2025), and Federal Reserve Economic Outlook (Beige Book, around November 26, 2025).
    • Regulatory Decisions: Watch for SEC decisions on potential new altcoin ETFs and tweaks to existing ETFs (e.g., staking integration). The ISO 20022 compliance deadline (November 22, 2025) is also relevant for traditional finance integration.
    • Crypto-Specific Events: Keep an eye on the Ethereum Fusaka Upgrade (November/December 2025) and further developments in AI-driven crypto narratives. The postponed Mt. Gox repayments (now October 2026) remain a long-term factor.

    This article is for informational purposes only and does not constitute financial or investment advice. Cryptocurrency investments carry significant risk.

  • Ethereum Tumbles 5.5% Amidst ETF Outflows and Technical Breakdown: A Deep Dive into Market Volatility

    Ethereum Tumbles 5.5% Amidst ETF Outflows and Technical Breakdown: A Deep Dive into Market Volatility

    October 30, 2025 – Ethereum (ETH) has experienced a significant price correction, with its value sliding by approximately 5.5% around October 29, 2025, reaching lows around $3,800. This downturn was primarily catalyzed by substantial institutional ETF outflows, totaling over $81 million, coupled with a critical technical breakdown that saw the second-largest cryptocurrency breach key support levels. The immediate market reaction has been one of heightened caution, with analysts and investors closely monitoring the implications for Ethereum's trajectory and the broader crypto ecosystem.

    This recent volatility highlights the growing influence of institutional capital flows and macroeconomic factors on digital asset prices. For ETH holders, the slide underscores the inherent risks in the market, prompting a re-evaluation of portfolios and a closer look at the technical health of the asset. The event serves as a stark reminder that even established cryptocurrencies are susceptible to rapid price swings driven by both fundamental shifts in institutional sentiment and critical technical indicators.

    Market Impact and Price Action

    The period around October 29, 2025, saw Ethereum's price under considerable pressure. ETH, which had been trading around $4,250, dipped significantly, with reports indicating a 24-hour loss of 2.89% on October 29, and a more pronounced slide to around $3,800 from its earlier highs, representing a roughly 10.5% decline from peak to trough. On the day of the most significant outflows, ETH was reported to trade around $3,995, marking a 2.00% drop over 24 hours, hitting a low of approximately $3,850.62. This downward movement was exacerbated by a broader market pullback, which included over $600 million in long liquidations across the crypto space.

    Technical analysis revealed Ethereum struggling to maintain positions above critical resistance levels. Key resistance was identified around $4,200 and $4,250, with a decisive break above $4,300 deemed necessary to negate bearish outlooks. The 100-day moving average also acted as a short-term resistance. On the support side, the $3,900–$3,950 zone initially provided strong defense, with bulls attempting to hold this line. However, the consistent selling pressure eventually pushed ETH towards crucial support between $3,850 and $3,680. A macro support level was noted at $3,500, a breach of which could signal a deeper retracement towards $3,000.

    Trading volume presented a mixed picture. Ethereum's 24-hour trading volume reportedly slipped to around $35.4 billion. In the futures market, open interest fell by 3.2%, suggesting an unwinding of short-term leveraged long positions. However, options volume saw a sharp jump, indicating increased speculative activity, particularly on potential price increases. The primary driver of this price action was the significant $81.44 million in net outflows from Ethereum ETFs on October 29. Fidelity's FETH led with $69.49 million in outflows, alongside contributions from Grayscale's ETH and ETHE, and VanEck's ETHV. Notably, BlackRock's ETHA was one of the few to record inflows, attracting $21.36 million. These outflows, signaling a bearish tilt in institutional sentiment, were reportedly triggered by cautious remarks from US Federal Reserve Chair Jerome Powell regarding future interest rate cuts, leading to "disappointed expectations in a market hypersensitive to liquidity signals."

    Historically, similar negative ETF flows have correlated with short-term price dips of 5-10% within 24-48 hours. Persistent outflows in late September and mid-October 2025 also coincided with a relative weakness in the ETH/BTC ratio, underscoring how institutional withdrawals can act as an "episodic headwind." Conversely, periods of increased ETF inflows have typically aligned with Ethereum price rallies, demonstrating the direct impact of institutional capital on ETH's market performance.

    Community and Ecosystem Response

    In the wake of Ethereum's price slide, the broader crypto community, while not immediately available for real-time sentiment analysis, likely reacted with a mixture of concern and strategic re-evaluation. On social media platforms like X (formerly Twitter) and Reddit, discussions would have intensified around the sustainability of current price levels, the resilience of key support zones, and the implications of institutional fund movements. Crypto influencers and thought leaders would likely have engaged in debates over whether the dip represents a healthy correction, a temporary setback, or a more significant shift in market dynamics.

    For the vast Ethereum ecosystem, including its burgeoning DeFi protocols, vibrant NFT projects, and innovative Web3 applications, the price correction would necessitate a period of heightened caution. DeFi protocols, particularly those with high collateralization ratios, might see increased liquidations as the value of staked ETH declines, potentially impacting overall Total Value Locked (TVL). NFT markets, often sensitive to broader crypto market sentiment, could experience reduced trading volumes and a softening of floor prices. Web3 applications, many of which rely on ETH for gas fees or underlying economic models, might face temporary user hesitability or adjustments in operational costs. Developers and project teams would likely reiterate their commitment to long-term roadmaps, emphasizing fundamental utility and ongoing technological advancements to reassure their communities amidst the market turbulence.

    What's Next for Crypto

    The recent Ethereum price slide and the accompanying institutional outflows carry both short-term and long-term implications for the broader crypto market. In the immediate future, increased volatility is expected as the market digests these developments. Ethereum's price trajectory will be heavily influenced by its ability to reclaim key resistance levels, particularly the $4,000 mark. A sustained move above this could signal a short-term recovery, potentially targeting $4,400–$4,550 by early November 2025. Conversely, a failure to hold current support could lead to further testing of lower price ranges.

    Looking ahead, several catalysts could shape Ethereum's path. The upcoming Fusaka upgrade (mainnet activation scheduled for December 3, 2025) is a significant development aimed at enhancing scalability and reducing transaction costs, which could act as a bullish driver by improving network efficiency and user experience. Beyond Fusaka, Ethereum's ambitious roadmap, including future upgrades like Glamsterdam, continues to promise long-term improvements. Macroeconomic factors, particularly future signals from the US Federal Reserve regarding interest rates and global economic stability, will also play a crucial role. Strategic considerations for projects include a renewed focus on fundamental utility, robust treasury management, and optimizing for scalability through Layer-2 solutions. Investors are advised to maintain a long-term perspective, consider dollar-cost averaging (DCA), and diversify portfolios to mitigate risks.

    Possible scenarios for Ethereum's price trajectory range from a short-term rebound and consolidation, potentially seeing ETH trade between $4,120 and $6,333 by the end of 2025, to continued volatility influenced by external factors. However, the long-term outlook remains largely bullish. Analysts predict ETH could reach new all-time highs, potentially exceeding $6,500 in 2025, and ranging from $10,000+ by late 2025 or 2026, and $16,000+ by 2030, driven by its foundational role in Web3, ongoing technological advancements, increasing institutional adoption, and deflationary tokenomics. The current price dip might be viewed by long-term holders as an accumulation opportunity.

    Bottom Line

    Ethereum's recent 5.5% price slide, triggered by significant ETF outflows and a technical breakdown, serves as a critical reminder of the crypto market's inherent volatility and its increasing susceptibility to institutional capital movements and macroeconomic shifts. For crypto investors and enthusiasts, the key takeaway is the paramount importance of monitoring both technical indicators and institutional sentiment. The substantial outflows from major Ethereum ETFs, particularly from Fidelity (Fidelity Investments, NASDAQ: FCNTX) and Grayscale (Grayscale Investments, OTC: GBTC), underscore a cautious shift among institutional players, which can have immediate and pronounced effects on price.

    Despite the short-term turbulence, Ethereum's long-term significance remains robust. Its foundational role in the decentralized finance (DeFi) ecosystem, its continuous technological advancements through ongoing upgrades, and its growing integration into traditional finance (e.g., JPMorgan (JPMorgan Chase & Co., NYSE: JPM) allowing ETH as collateral) position it as a resilient asset. The current market conditions present an opportunity for strategic re-evaluation, encouraging investors to focus on projects with strong fundamentals and to adopt prudent risk management strategies like dollar-cost averaging.

    Important dates and metrics to monitor include the upcoming Fusaka upgrade in December 2025, which could act as a positive catalyst, ongoing ETF flow data for signs of renewed institutional interest, and key technical support and resistance levels. While cryptocurrency investments carry significant risk, Ethereum's underlying utility and developmental roadmap suggest that such corrections, while painful in the short term, are often part of a larger, long-term growth trajectory for the asset and for broader crypto adoption.


    This article is for informational purposes only and does not constitute financial or investment advice. Cryptocurrency investments carry significant risk.

  • Toncoin at a Crossroads: Technical Analysis Points to Crucial Levels as Regulatory Scrutiny Looms

    Toncoin at a Crossroads: Technical Analysis Points to Crucial Levels as Regulatory Scrutiny Looms

    October 2, 2025 – Toncoin (TON) finds itself at a pivotal juncture, trading around the $2.82 mark amidst a complex interplay of technical indicators, institutional maneuvers, and escalating regulatory pressures. After a tumultuous September that saw its value dip by 13%, the cryptocurrency, deeply integrated within the Telegram ecosystem, is testing critical support levels while grappling with muted market reactions to otherwise bullish news. The current landscape for TON is not just a reflection of its on-chain metrics but also a barometer for how institutional crypto adoption and regulatory oversight will shape the broader Web3 space.

    This period of consolidation and uncertainty for Toncoin is particularly significant given its unique position. As a central component of Telegram's expanding Web3 ambitions, TON's performance and stability are closely watched by a vast user base and a growing number of developers. The disjunction between positive fundamental developments, such as extensive staking initiatives and AWS integration, and its bearish price action underscores the market's sensitivity to external factors, especially the increasing scrutiny from regulatory bodies like the SEC and FINRA.

    Market Impact and Price Action

    Toncoin's recent price action paints a picture of a token under pressure, despite impressive long-term growth. As of October 2, 2025, TON is trading at approximately $2.82 USD, reflecting a modest 2.21% gain over the last 24 hours. However, this short-term uptick comes after a challenging period; the token experienced a 13.93% decrease in value over the last 30 days, contributing to a substantial 51.94% year-to-date decline relative to a generally bullish market. Despite these recent dips, TON has demonstrated remarkable resilience over the past 12 months, exploding by 265%. Since April 2025, Toncoin has largely been in a phase of sideways consolidation, fluctuating between $2.73 and $3.45, indicating a struggle for a decisive directional move.

    The 24-hour trading volume for Toncoin on October 2, 2025, stands at approximately $150.98 million USD. While this represents a healthy level of activity, the volume-to-market-cap ratio is currently low at 1.51%. This low ratio suggests that while there is consistent trading, significant shifts in market sentiment could trigger larger price movements due to less resistance from existing liquidity. The muted market reaction to significant bullish news, such as the TON Strategy Company staking 82% of its reserves and AlphaTON Capital acquiring $30 million in TON, highlights a disconnect between fundamental developments and immediate price appreciation, potentially exacerbated by broader market uncertainties.

    From a technical analysis perspective, Toncoin is currently navigating several crucial levels. Immediate support is identified around $2.58, with a more robust and historically significant support level at $2.625, which has previously acted as a reversal point for price declines since March 2025. The range of $2.30–$2.90 is considered a critical support zone that TON must maintain to prevent further downside. On the resistance front, immediate hurdles begin at $3.27, followed by significant resistance at $3.44. The 200-day Exponential Moving Average (EMA) near $3.50 also presents a formidable barrier. A decisive breakout above the $3.75 resistance level would be a strong bullish signal, potentially paving the way for further gains towards $4.20 and even $4.68.

    Bearish signals persist on the four-hour timeframe, with both the 50-day and 200-day moving averages sloping downwards. The 50-day EMA is currently positioned at $2.91, acting as dynamic resistance. Despite the overall bearish sentiment, the Relative Strength Index (RSI) is hovering around 28.22, indicating an "oversold" condition. Historically, such RSI readings often precede price bounces, suggesting a potential for a short-term recovery. However, the prevailing sentiment remains bearish, with 21 technical indicators signaling bearish trends compared to only 9 bullish ones, underscoring the challenges Toncoin faces in establishing a clear upward trajectory.

    Community and Ecosystem Response

    The Toncoin community and the broader crypto ecosystem are reacting with a mixture of cautious optimism and concern, particularly in light of recent institutional movements and regulatory developments. On social media platforms like X (formerly Twitter) and Reddit, discussions around TON often revolve around its potential for mass adoption through Telegram's vast user base, juxtaposed with anxieties over price volatility and the impact of external market forces. While some community members express strong conviction in TON's long-term vision, especially with its integration into Telegram's payment infrastructure for creators and premium subscriptions, others voice frustration over the token's inability to capitalize on positive news.

    Crypto influencers and thought leaders have offered varied perspectives. Many acknowledge the fundamental strength of Toncoin's integration with Telegram, seeing it as a unique pathway to Web3 adoption. The launch of the self-custodial wallet "TON Space" for Telegram's 900 million users is widely lauded as a significant step towards enhancing utility and accessibility. However, the recent regulatory scrutiny involving Digital Asset Treasury (DAT) firms like TON Strategy Company and AlphaTON Capital has introduced a new layer of complexity. Influencers are closely monitoring the investigations by the SEC and FINRA into unusual stock trades preceding crypto purchase announcements, viewing this "regulatory heat" as a potential drag on institutional buying pressure—a key demand source for TON.

    The effects on related DeFi protocols and Web3 applications within the TON ecosystem have also been notable. While network activity remains robust, with daily transactions averaging 2.16 million and over 162 million total accounts, the Total Value Locked (TVL) in TON's DeFi ecosystem has experienced a significant downturn. After peaking at $600 million in early 2025, the TVL dropped to approximately $400 million following the conclusion of an incentive program, representing a 71% decline in the past quarter. Despite this, the integration of Toncoin into AWS's Managed Blockchain service on September 10, 2025, offering developers real-time analytics tools, is seen as a positive step for the network's long-term ecosystem development and developer engagement.

    What's Next for Crypto

    The immediate future for Toncoin, and by extension, certain segments of the broader crypto market, appears to be shaped by a delicate balance of internal ecosystem developments and external macroeconomic and regulatory forces. Short-term forecasts for TON suggest a potential for modest recovery or continued consolidation. Binance (NASDAQ: BNBC) anticipates a 5% increase within the next 30 days, while CoinCodex projects a rise to $3.15 by October 31, 2025, with an average monthly trading range of $3.01. However, these optimistic outlooks are tempered by the immediate downside risk to $2.61 highlighted by other analyses, underscoring the volatility inherent in the current market.

    Long-term implications for the crypto market, particularly for projects with strong institutional backing or significant user integration like Toncoin, will heavily depend on the resolution of regulatory uncertainties. The ongoing investigations into DAT firms could set precedents for how institutions engage with digital assets, potentially influencing future investment flows. On a more positive note, the expected 25 basis point interest rate cut by the U.S. Federal Reserve in September 2025 (though the current date is Oct 2, 2025, so this would be a past event that might have impacted the market) is anticipated to provide a tailwind for the overall crypto market, including TON, by increasing liquidity and investor appetite for risk assets. However, the recent arrest of Telegram founder Pavel Durov, though reportedly a short-term impact, adds another layer of unpredictability, reminding the market of the influence of key figures.

    Strategic considerations for projects and investors in this environment involve closely monitoring regulatory developments and focusing on fundamental utility. For projects, continuing to build out robust ecosystems, fostering developer engagement, and enhancing real-world utility, as Toncoin is doing with Telegram integrations, will be crucial for long-term resilience. Investors might consider a cautious approach, focusing on dollar-cost averaging into projects with strong fundamentals and clear use cases, while being prepared for continued volatility. Potential catalysts to watch include further clarity on regulatory frameworks, additional institutional adoption announcements that are not marred by controversy, and continued growth in Telegram's Web3 features, which directly benefit TON.

    Bottom Line

    Toncoin is currently navigating a complex landscape, presenting both significant opportunities and considerable risks for investors and enthusiasts. The technical analysis points to critical support levels that must hold to prevent further declines, while the Relative Strength Index suggests a potential for a short-term bounce. Key takeaways include the strong long-term growth potential driven by its deep integration with Telegram's massive user base, but also the immediate challenges posed by regulatory scrutiny and a recent downturn in its DeFi TVL.

    The long-term significance of Toncoin's current trajectory extends beyond its own price action, serving as a case study for the broader implications of institutional involvement and regulatory oversight in the crypto space. The outcome of the SEC and FINRA investigations into DAT firms could shape future institutional investment strategies and influence how digital assets are perceived and regulated globally. For crypto adoption, TON's success in leveraging Telegram's ecosystem for payments and Web3 applications will be a crucial indicator of how effectively cryptocurrencies can be integrated into mainstream platforms.

    Important dates and metrics to monitor include the progress of the regulatory investigations, any further announcements regarding TON Strategy Company's staking initiatives, and the continued growth of Telegram's Web3 features and user adoption. Investors should also keep an eye on the macroeconomic environment, particularly interest rate decisions, which can significantly impact risk asset markets. While the path ahead for Toncoin may be volatile, its fundamental integration with one of the world's largest messaging platforms provides a unique foundation for potential future growth, provided it can successfully navigate the current headwinds.

    This article is for informational purposes only and does not constitute financial or investment advice. Cryptocurrency investments carry significant risk.